
Introduction
What a Split Shipment Actually Costs: A Component-by-Component Build-Up
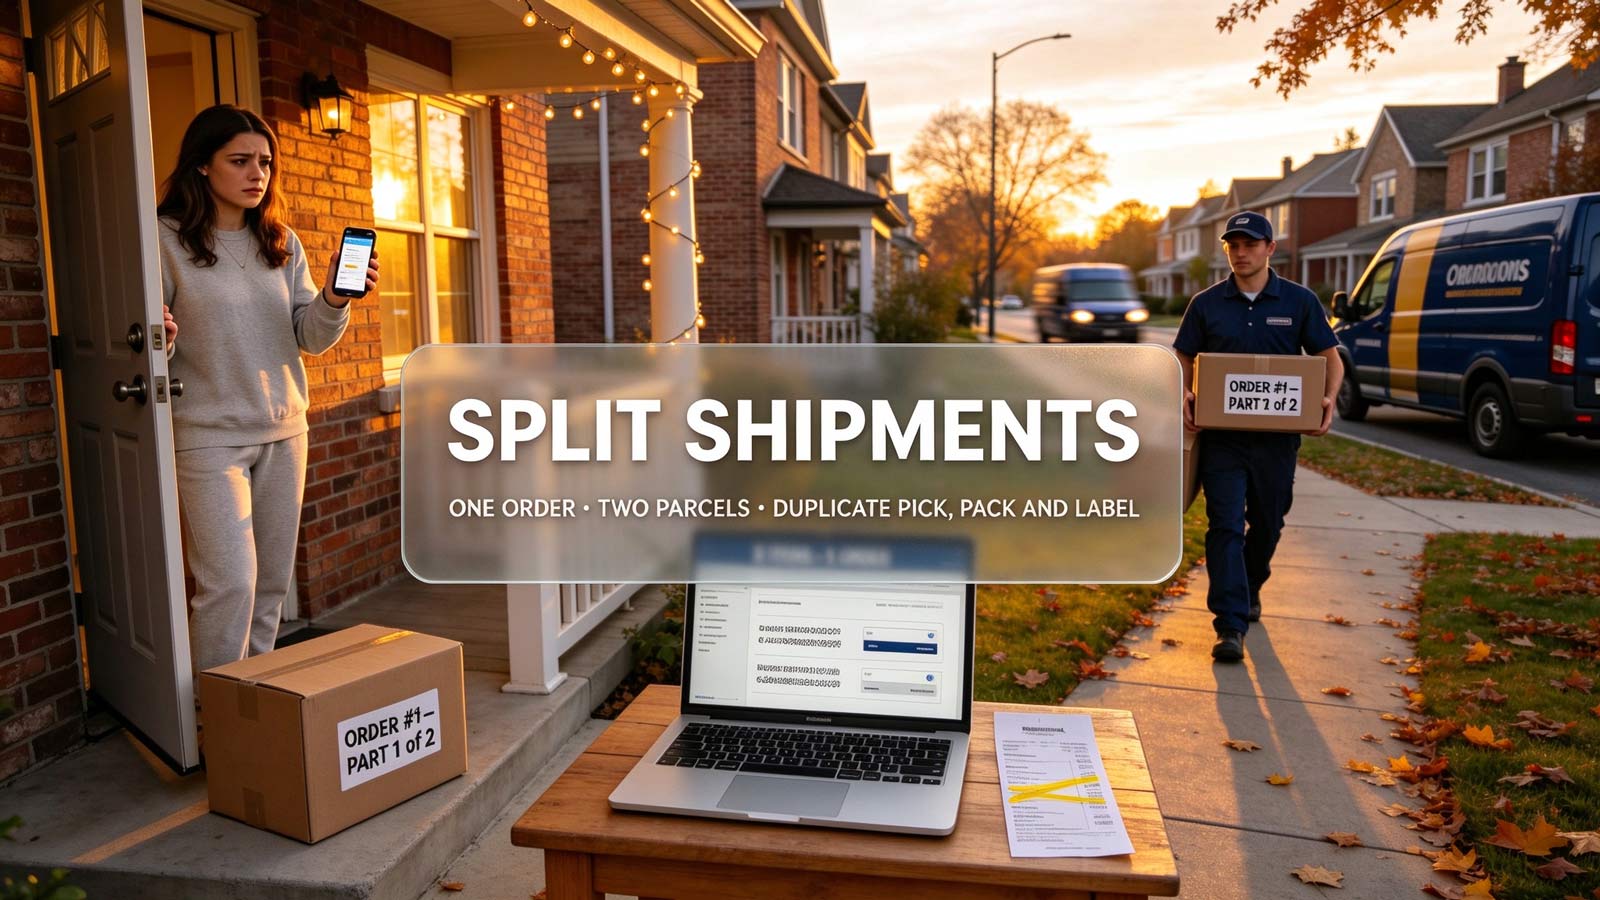
Instead of a headline percentage, here is the arithmetic with every assumption visible. Take a representative cross-border parcel with a $6.50 last-mile charge and $1.80 in pick-and-pack labor:
- Second last-mile fee: +$6.50 (100% of base — direct derivation, not estimate)
- Duplicate pick, pack and label: +$1.80 (same labor performed twice)
- Extra packaging materials: +$0.40–$0.90 depending on SKU size
- Incremental WISMO support: industry benchmarks put support cost per ticket at $3–$5; split-shipment orders generate roughly 1.5–2x the tickets of single-parcel orders, adding ~$1–$3 per affected order
Bottom line: each forced split adds roughly $9–$12 of direct cost to a $6.50 parcel — a 140–185% cost increase on the affected orders, not on total order volume. A store with a 10% split rate therefore loses about 1.4–1.9% of gross margin to splits; a store with a 25% split rate loses 3.5–4.6%. The right number for your store is computable from your own data, and the formula above is the method.
Data Source and Conflict-of-Interest Statement
This analysis draws on aggregated order-splitting data from stores fulfilling through our own warehouse network, which creates a conflict of interest: Globe Fulfillment sells the multi-node fulfillment services discussed below. To mitigate this:
- the cost build-up above uses only arithmetic and publicly available carrier rate structures, and can be verified independently;
- where we cite operational patterns from our network, we present them as directional observations, not industry statistics;
- the following section covers the costs of the very solution we sell.
Readers should apply the audit framework to their own data rather than trusting our aggregates.
The Four Operational Triggers Behind Split Shipments
Moving inventory into multiple nodes to prevent splits is not free, and honest analysis must price it:
- Inventory dispersion raises total safety stock. With independent demand per node, required safety stock scales roughly with the square root of node count (the classic square-root law of inventory pooling). Two nodes ≈ 41% more safety stock; three ≈ 73% more. That working capital has a carrying cost of 15–30% annually.
- Duplicated storage and inbound fees. Each node charges receiving, storage and return handling; splitting volume across nodes also weakens your rate negotiation position per node.
- Inter-node transfer freight. Rebalancing stock between warehouses after demand surprises costs real money and real lead time.
- Forecast error multiplies per node. A 10% forecast error at one node is manageable; the same error across five nodes creates simultaneous overstock and stockout, which can increase split rates via partial availability.
When multi-node pays off: high co-purchase attachment between SKUs, high order volume density in a region, and SKU portfolios small enough that nodes stay well-forecasted. When it doesn't: long-tail catalogs, volatile demand, or stores still building order volume. The correct answer is a per-store calculation — not a universal prescription.
A Decision Framework, Not a Pitch
- Measure your split rate (orders in 2+ parcels ÷ total orders) and the per-split cost using the build-up above.
- Estimate your consolidation cost using the square-root inventory math and your actual storage rates.
- Compare the two numbers. If annual split cost < annual added inventory carrying cost, fix routing and kitting within your existing node first — this fixes 40–60% of splits with zero added inventory.
- Add a consolidation tolerance to routing ("hold up to 48 hours if it merges parcels") before ever adding nodes. It converts many would-be splits into single shipments at the cost of slightly slower delivery, not of more stock.
Core Takeaways
- Price splits from your own data using visible arithmetic — each forced split adds roughly $9–$12 on a representative $6.50 parcel (second last-mile fee + duplicate labor + materials + support load), which at a 10% split rate costs ~1.4–1.9% of gross margin.
- Treat vendor-published network data as directional, not authoritative — this article's operational observations come from Globe Fulfillment's own fulfillment network, and that conflict of interest should be weighted accordingly.
- Multi-node consolidation has a real, quantifiable cost — safety stock grows roughly with the square root of node count, plus duplicated storage fees and transfer freight; it is a cure for some stores, an expensive over-correction for others.
- Exhaust single-node fixes first — routing consolidation tolerances and physical kitting eliminate most splits without adding any inventory; only compute multi-node economics if those plateau.