
Introduction
Every peak ecommerce season brings the same misleading win: traffic spikes, average order value climbs, and teams celebrate — until the P&L lands, revealing profit per order has slipped.
For cross-border sellers on the Globe Fulfillment network, this “basket illusion” is one of the most pervasive hidden leaks. Your dashboard looks healthy, yet your store makes less money on each sale. This Store Analysis breaks down what creates the illusion, how to diagnose it with your own order data, and which operational levers you can pull to lock in genuine profit ahead of Black Friday.
What the Basket Illusion Looks Like in Your Dashboard
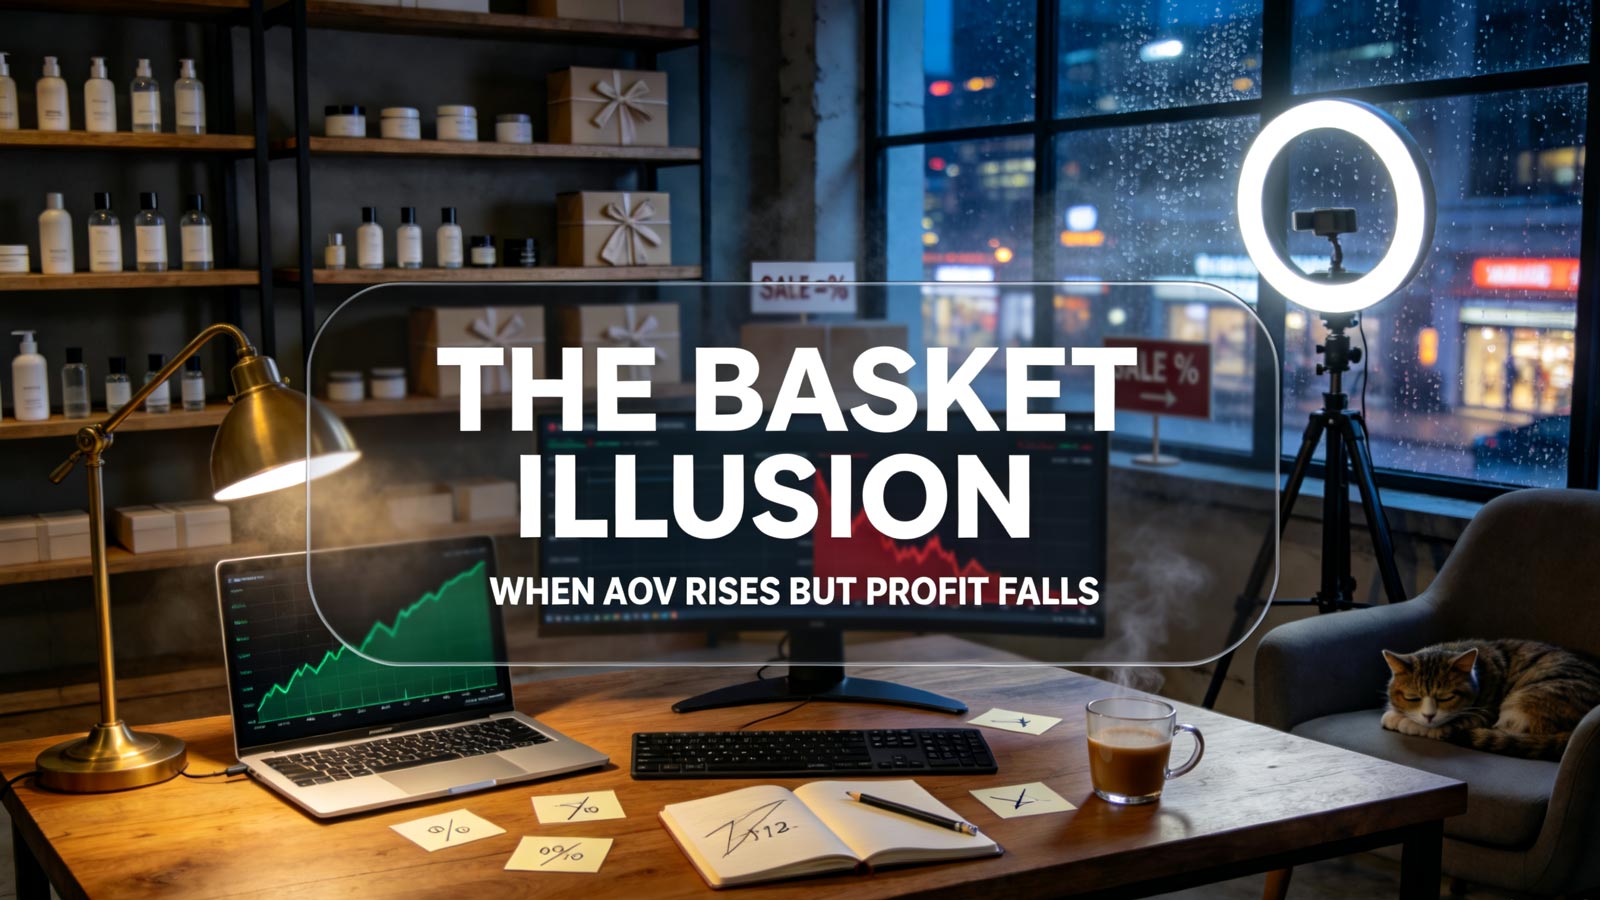
The illusion is a divergence, not an obvious drop. It is common to see AOV rise 11–14% year over year, while contribution margin per order quietly falls by 3–5 percentage points.
On the surface, everything checks out: traffic stays steady, conversion holds, and customer reviews remain strong. The damage only surfaces when you calculate what you actually retain after all variable costs are accounted for.
The core issue: AOV is a gross, checkout-time metric. It is captured before discounts finalize, before shipping costs are matched to each basket, and before returns erase booked revenue. Three common tactics can push AOV higher while dragging down per-order profitability.
Three Drivers That Inflate AOV Without Growing Profit
- Free-shipping threshold add-ons. When your free shipping minimum sits at $75 and the typical basket lands around $61, shoppers add low-cost accessories just to clear the threshold. These add-ons — cables, socks, cleaning cloths — are usually your lowest-margin SKUs. Basket value goes up, but the blended margin of the whole order shrinks.
- Multi-unit volume discounts. “Buy 2, save 15%” promotions lift unit count and AOV at the same time. Too often, the discount erodes more margin than you save by packing two items into one parcel. You see larger baskets and assume operational efficiency, but your profit statement tells the opposite story.
- Returned revenue. AOV records the full value at checkout. For categories with return rates of 30–40%, a meaningful portion of that booked revenue will reverse within weeks. Higher return rates make AOV an increasingly inflated measure of sustainable demand, and aggressive discounting feeds the cycle further.
The Profit-per-Order Audit: Five-Step Checklist
- Recalculate contribution margin per order. Deduct COGS, outbound shipping, payment fees, packaging and projected return costs from net revenue, calculated at the order level rather than per individual product.
- Plot 90 days of AOV alongside margin per order. If the two lines move in opposite directions, the basket illusion is active and worsening.
- Segment baskets by their growth trigger: threshold-driven carts, promo-code carts, bundles, and organic single-item purchases. Compare profitability across these four groups.
- Flag profit-negative orders. Merchants in our network frequently discover 8–12% of orders lose money, concentrated heavily in threshold-add-on baskets.
- Rank add-on SKUs by attach rate against margin. The highest-converting add-ons are often your biggest margin drags — and the fastest fix.
Fix the Product Mix Without Tanking Conversions
Design shipping thresholds around margin, not just dollar value. Replace generic low-margin filler add-ons with a small set of curated, high-margin accessories displayed right next to the cart progress bar.
Set a hard margin floor, for example a 35% minimum contribution margin for bundles, and let your promotion rules enforce it automatically. Shift campaign KPIs away from raw AOV and toward profit per order. For high-return categories, bake expected return costs into pricing from the start.
One 3C accessories brand in our network ran this exact playbook. Initially, AOV was up 14% while profit per order dropped 6%. Sixty days after swapping threshold add-ons and enforcing bundle margin floors, profit per order recovered fully — while AOV kept its gains intact.
Core Takeaways
- Rising AOV and falling per-order profit can coexist for months without triggering alerts, because AOV hides the true cost structure of each basket.
- Threshold add-ons, multi-unit discounts and return-churned revenue are the top three AOV inflators that reduce, rather than boost, profit.
- This five-step audit can uncover the margin leak in under two weeks: rebuild order-level margin, track divergence, segment basket types, flag loss-making orders, and rank add-ons.
- Shift promotion targets from AOV to contribution margin per order and enforce bundle margin floors. The same traffic will generate sustainable profit instead of inflated, cosmetic basket value.