
Introduction
Why Price Band Is a Selection Input, Not an Output
Price band operates as a filter because it changes buyer psychology and unit economics simultaneously. Three mechanisms do most of the work:
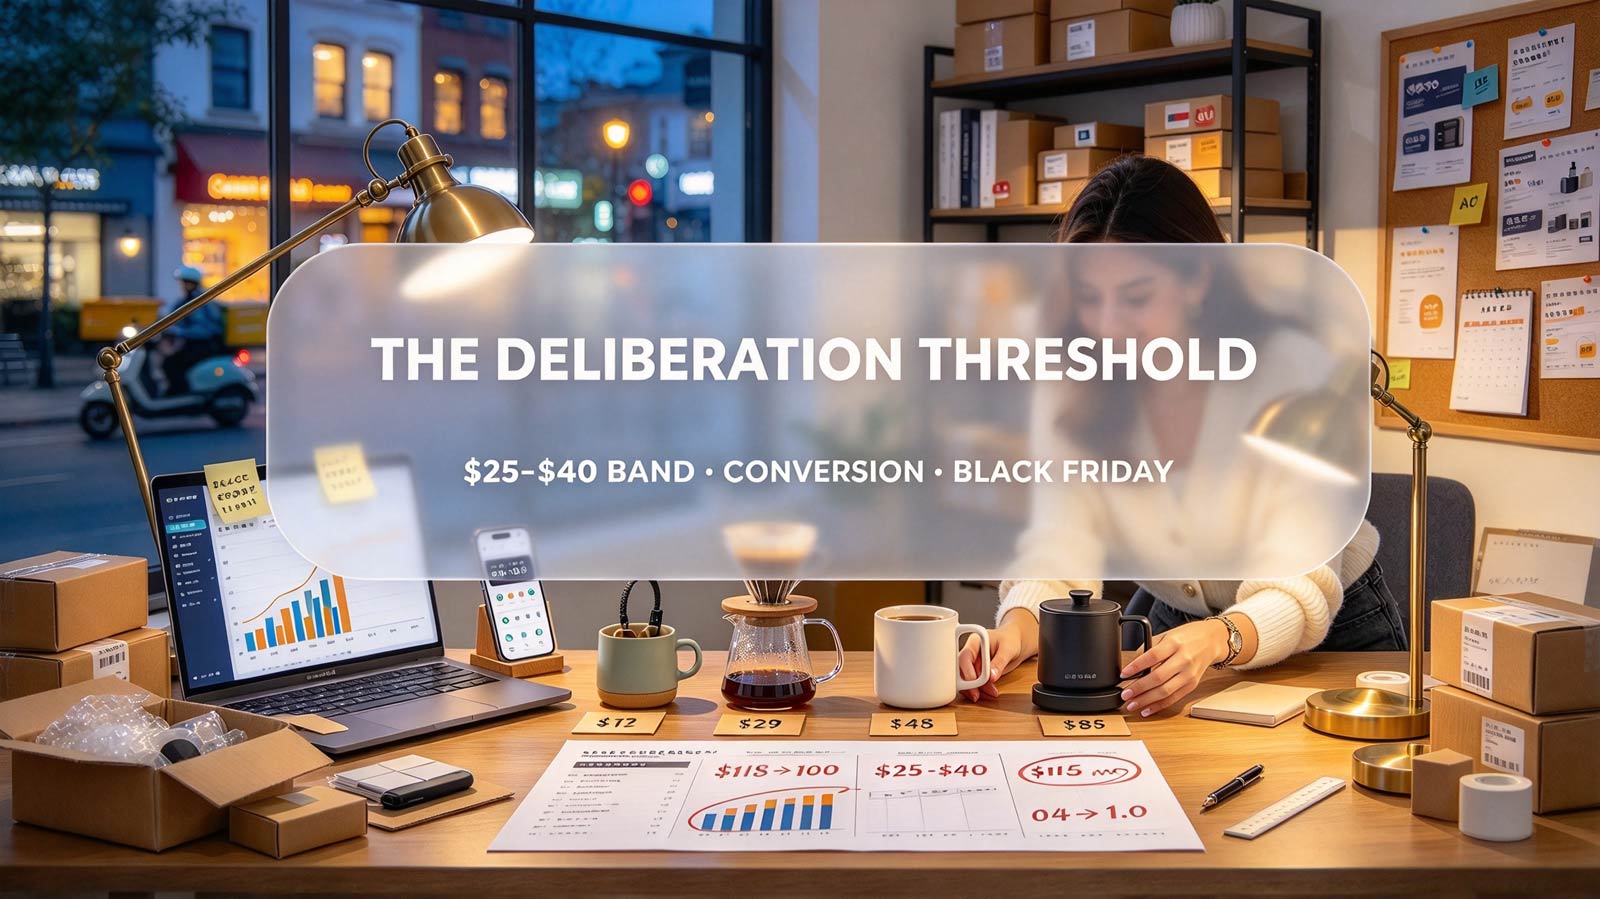
- Deliberation threshold. Under roughly $40, purchases skip the comparison-shopping stage; above it, buyers open new tabs, check reviews and wait for coupons. Every step of that deliberation funnel bleeds conversion—data shows checkout completion falling 20–35% once the "should I think about this?" switch flips.
- Logistics leakage ratio. On a $15 product, a $6–$8 cross-border delivery cost consumes up to half of revenue before COGS; on a $35 product, the same shipping cost is a manageable 20%. Below the band, fulfillment quietly eats the margin that demand signals promised.
- Return asymmetry. Sub-$20 items trigger skepticism-driven returns ("too cheap to be good"), while purchases above $50 become considered decisions that draw heavier return scrutiny when expectations miss. The $25–$40 window sits in the pocket where expectation and reality most often match.
Benchmark: Performance by Price Band
Data source: anonymized order-level data from more than 2,400 cross-border stores on Globe Fulfillment's network (Shopify, WooCommerce, TikTok Shop), July 1–September 30, 2026; home, lifestyle and accessories. Conversion indexed to the $25–$40 band at 100; contribution per session is per-visitor margin after COGS, shipping, payment and expected returns.
- Under $15: conversion index 118, contribution just 40 percent of the impulse band's;
- $15–$25: conversion 108, contribution 70 percent of baseline—works only for ultra-light, flat-shipping items;
- $25–$40 (impulse band): conversion 100, contribution 100—the only band where strong conversion and healthy unit economics overlap;
- $40–$70: conversion 74, contribution 90 percent of baseline—needs strong review depth or brand trust;
- Above $70: conversion 52, contribution 60 percent on cold traffic—mainly a retargeting or email-channel play.
The under-$15 row shows why "low price, high volume" fails: processing fees carry a fixed floor per transaction, per-parcel shipping barely shrinks with volume, and ad spend scales with orders—when per-order contribution is negative, scale amplifies the loss instead of curing it. CAC payback follows the same curve: 11 days in the impulse band, 34 at $40–$70, more than 45 above $70.
Where the Impulse Band Breaks
The band is a prior, not a law. Four conditions break it:
- Certification-heavy 3C accessories routinely sustain $45–$65 price points because certified quality justifies deliberation—buyers accept the pause;
- Apparel under $35 inherits bracketing returns (shoppers ordering multiple sizes with the intent to return most), so part of the band's margin advantage is surrendered to reverse logistics;
- Gift-season ceilings compress upward—Q4 gifting psychology favors $30–$50 "safe gift" price points, temporarily widening the effective window;
- Deep-discount events reset the anchor—a hero SKU listed at $38 and discounted to $26 permanently trains buyers to wait, so band placement must survive your promo calendar (see our Store Analysis column on markdown math).
Stores that treat these as exceptions rather than excuses keep the band's economics while adapting its edges.
The 37-Day Timeline: A Dated Audit Plan
With 37 days to Black Friday, the audit compresses into four dated steps:
- This week (by Oct 27): export all active SKUs with 90-day conversion rate, contribution margin and return rate, bucketed by price band; compute contribution per session for each band;
- Weeks 2–3 (Oct 28–Nov 10): re-slot the flagged SKUs—re-slotting means repositioning a product into a different effective price point via bundles or repricing, not discounting. Test two-unit bundles for sub-$25 SKUs and review-depth checks for SKUs above $40;
- Week 4 (Nov 11–17): freeze structural changes; only messaging and creative iterate from here;
- Nov 18–26: monitor band-level contribution daily; bundles that miss the band's economics get pulled before peak, not after.
Stores running this timeline consistently move 15–20% of their catalog into the impulse window before peak traffic arrives—the cheapest conversion lift available before Black Friday.
Core Takeaways
- Price band is a selection input, not an output: the $25–$40 window is where impulse-level conversion and healthy cross-border unit economics overlap.
- Below the band, fixed per-order fees make volume amplify losses rather than cure them; above it, deliberation bleeds 20–35% of checkout completion.
- CAC payback averages 11 days in the impulse band versus 34 days at $40–$70 and more than 45 days above $70—band placement decides whether ad scaling self-funds.
- With 37 days to Black Friday: audit this week, re-slot via bundles by Nov 10, freeze by Nov 17.